PROBABILISTIC SEISMIC HAZARD ASSESSMENT IN THE BLACK SEA AREA
Cornell - McGuire Statistical Method Used For The Seismogenic Process Modeling In The Black Sea Areal
The parameters of the Gutenberg-Richter distribution (a, b) are compiled for each source (http://tsunami.infp.ro/en/seismic.php). Also we mapped the b values (Figure 1) to emphasize the zones with low and high stress, for different time intervals.
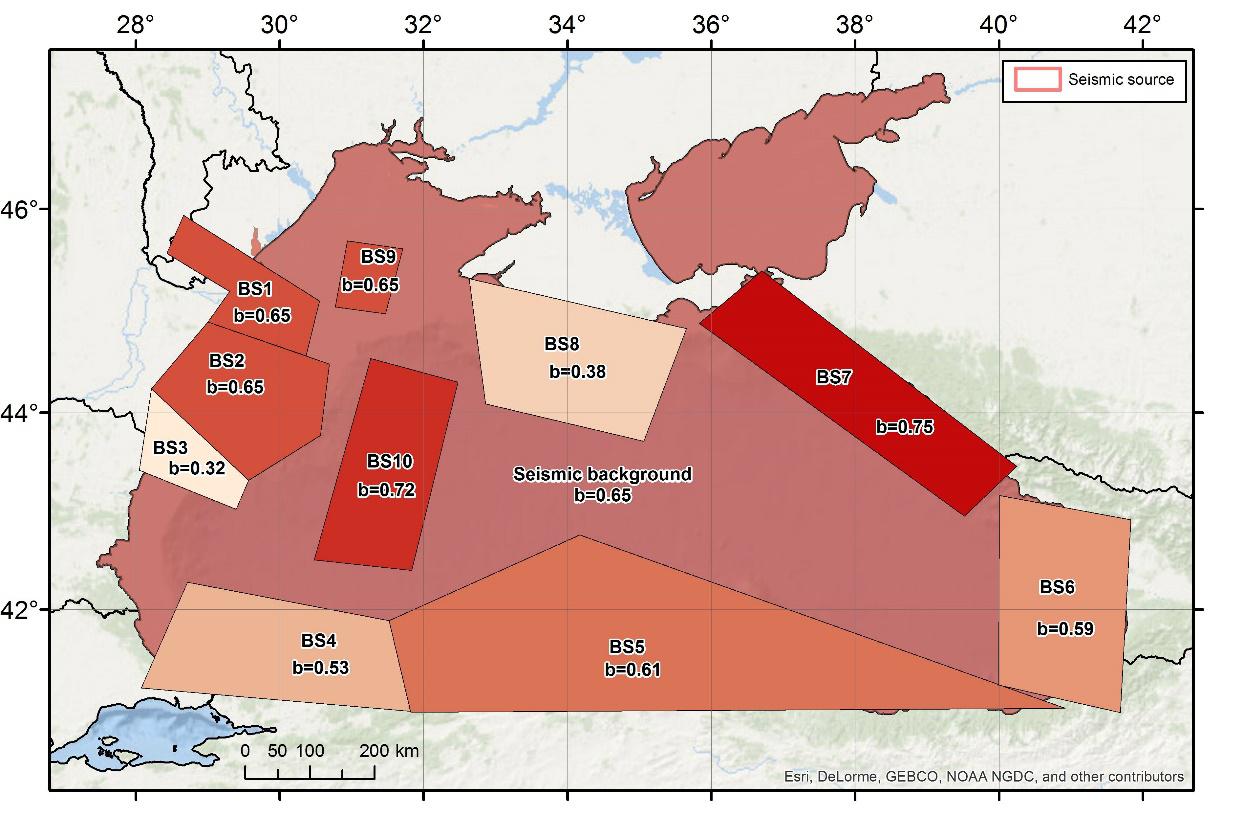 Figure 1. b values for BSi sources
In Table 1 are presented the characteristics of each source from the Black Sea (BSi) that will be used in the seismic hazard assessment with the Cornell method. Because BS1, BS9 and S10 are very low risk seismic sources they will not be further analyzed.
Table 1.
|
Seismic Sources |
M min (Mw) |
M max (Mw) |
Mmax comp (Mw) |
Seismic Sources |
M min (Mw) |
M max (Mw) |
Mmax comp |
|
BS1 |
3.0 |
3.5 Mb=4.7 |
- |
BS6 |
3.0 |
5.5 |
5.7 |
|
BS2 |
3.0 |
5.0 |
5.6 |
BS7 |
3.0 |
5.2 |
5.8 |
|
BS3 |
3.0 |
7.2 |
7.5 |
BS8 |
3.0 |
6.5 |
6.8 |
|
BS4 |
3.0 |
6.7 |
7.2 |
BS9 |
3.0 |
4.9 |
- |
|
BS5 |
3.0 |
6.1 |
6.3 |
BS10 |
3.0 |
3.9 |
- |
With the input data set from Table 1, we have applied the algorithm of McGuire, 1976 and the EqRisk program to compute the seismic hazard parameters for BS1-S8 seismic sources: the number of events with a given magnitude per year, the annual hazard, the hazard for 50, 100, 475 and 1000 years, the return periods for different magnitudes. Using numerical computations we have also obtained the maximum possible magnitude for each zone (see columns 4 and 8 from Table 1).
We observe that the computed values are in good correlation with the maximum observed magnitudes being included in the degrees of magnitude. The return periods seems to be very large and far from those expected. As an example in Table 2 are the return periods for Mw=6 for sources BS2-BS8
Table 2. The return periods for Mw=6 for sources BS2-BS8
|
Source |
BS2 |
BS3 |
BS4 |
BS5 |
BS6 |
BS7 |
BS8 |
|
Tr (years) |
>10000 |
1422 |
134 |
2778 |
>10000 |
>10000 |
3717 |
In figure 2 we have represented the dependence of the expected magnitude versus the return period and the hazard curves for sources BS3 - Shabla, the one that could affect the Romanian Black Sea coast.
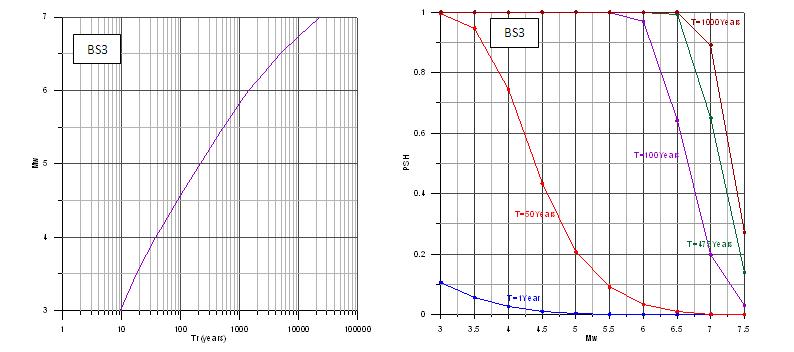
Figure 2. Return periods for earthquakes with different magnitudes (left) and the hazard curves for different exposure periods (right) for seismic source BS3 Extreme Values Gumbel I (GI) Statistical Method Used For The Seismogenic Process Modeling In The Black Sea Areal
The first one to recognize the close relationship between the weakest connection model and asymptotic theory of extreme values ??was Peirce - one of the first authors of statistical models of parts. Gumbel's extreme value theory implies the existence of three types of asymptotic distributions of extreme values ??(or cumulative distribution function) as the variable is unlimited, having lower and upper limits respectively.
The extreme value theory applied to the occurrence of maximum magnitude earthquakes is based on the following hypotheses (Yegulap, Kuo, 1974):
A. The occurrence of maximum magnitude earthquake in a seismic region in a certain period of time is a random, independent event.
B. The behaviour of maximum magnitude earthquake in the future will be similar to that of previous years of observation.
This method is mainly used when working with extreme values ??of statistical variables such as magnitude or maximum ground acceleration. For the maximum magnitude earthquake occurrence study were considered only the first and the third distribution.
In Figure 3 to are represented the return periods for most probable and expected magnitudes (a) and the hazard curves (b) for different periods of time fos BS3-Shabla.
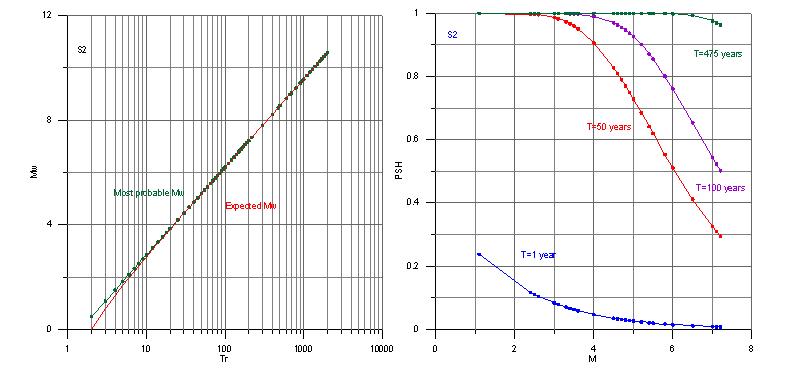 Figure 3. a. Most probable and the expected magnitude as function of the return period Tr for BS3; b. Hazard curves for BS3 (Shabla)
Conclusions
During this study we have obtained the PSH curves and the return periods of different magnitudes for the seismic sources from the Black sea Basin, using two analyzing methods (Cornell and Gumbel). With the first analyzing method (Cornell) the return periods of different magnitudes seems to be large in comparison with the return periods obtained using the second statistical processing method (Gumbel). As an example in Table 3 are the return periods for Mw=6 for sources BS2-BS8 for both analyzing methods.
Table 3. The return periods for Mw=6 for sources BS2-BS8
|
Source |
BS2 |
BS3 |
BS4 |
BS5 |
BS6 |
BS7 |
BS8 |
|
Tr (years) Cornell |
>10000 |
1422 |
134 |
2778 |
>10000 |
>10000 |
3717 |
|
Tr (years) GI |
250 |
90 |
- |
95 |
- |
130 |
55 |
Comparing the results from Table 4 we can see the huge differences in the values of the return period. A possible explanation is given by the fact that the GI distribution is not limited in the superior part leading to a very fast growth of the magnitudes in time. Another credible explanation of this differences is given by the earthquake catalogs for all this sources, catalogues that reveal the low earthquake potential of the sources and also the bad coverage with recordings systems of the Black Sea basin leading to inconsistent catalogues. The solution for this issue is a joint seismic monitoring of the Black Sea basin, involving all countries around the sea.
The maximum expected magnitude obtained with both methods for the studied seismic sources are presented in Table 4 together with the maximum observed magnitude.
Table 4. The return periods for maximum expected magnitudes in 1000 years for sources BS2-BS8
|
Source |
BS2 |
BS3 |
BS4 |
BS5 |
BS6 |
BS7 |
BS8 |
|
M (1000 years) Cornell |
5.0 |
5.9 |
6.7 |
5.7 |
5.1 |
5.4 |
5.5 |
|
M (1000 years) GI |
6.4 |
8.4 |
- |
7.5 |
- |
6.8 |
8.5 |
|
Mmax observed |
4.6 |
7.2 |
6.7 |
6.1 |
5.5 |
5.2 |
6.5 |
As we expected, the magnitude values for the GI method are very high in comparison with those obtained usig the Cornell method and also with those observed. The explanation is the same as for the low values of return periods, i.e. the working hypothesis without upper limit for the magnitude.
That's why the Gumbel III extreme values distribution studies should be needed for the sources from Black Sea Basin. Unfortunately the existing catalogues does not permit this type of numerical statistical analysis.
The final conclusion is that for a reliable statistical seismic analysis of the Black Sea areal is needed a common and uniform seismic monitoring for all states along the sea coast.