SEISMIC ZONATION OF THE BLACK SEA AREA
For probabilistic hazard assessment purposes INCDFP researchers have used the seismic zonation represented in Figure 1 that includes both normal and intermediate-depth earthquakes from the Black Sea and the South Eastern part of Romania.
In order to have the most reliable and homogeneous seismic dataset, the catalogues available at the European scale covering historical and modern instrumental seismicity until present days (ANSS-Advanced National Seismic System-USA, NEIC - National Earthquake Information Centre, World Data for Seismology Denver-USA, ISC-International Seismological Centre-UK) and the catalog of the National Institute for Earth Physics (Romplus catalogue, Oncescu et al., 1999, updated) have been compiled.
The seismic zonation of the Eastern part of Romania and the Black Sea Area was obtained using the distribution map of earthquakes and the map of the zones with active tectonics (Radulian et al., 2000; Moldovan, 2008, 2013, 2016). The seismic zonation of the Black Sea Area was obtained using the distribution map of earthquakes and the map of the zones with active tectonics. We took into consideration various past seismic zonation studies carried out in the framework of different projects (SHARE project - http://www.share-eu.org, MARINEGEOHAZARD project - www.geohazard-blacksea.eu, DARING project - http://daring.infp.ro/ and ASTARTE RO project -astarte-ro.infp.ro BIGSEES project - http://infp.infp.ro/bigsees/default.htm,). The seismic source configuration in Figure 1 is a synthesis of all the previous approaches.
The present configuration of the potential seismic sources contains fifteen crustal and one intermediate-depth seismic sources: Vrancea intermediate-depth (VRI), Vrancea normal (VN), Barlad Depression (BD), Intramoesian Fault (IMF), North Dobrogea (PD), North Dobrogea Black Sea (BS1), Central Dobrogea (BS2), Shabla (BS3), Istanbul (BS4), North Anatolian Fault (BS5), Georgia (BS6), Novorossjsk (BS7), Crimeea (BS8), West Black Sea (BS9) and Mid Black Sea (BS10). The input parameters describing the seismic sources requested for a probabilistic evaluation of seismic hazard are given in Table 1.
Table 1. Parameters needed for a probabilistic hazard assessment: geographical distribution, average depth, activity rate and Gutenberg Richter parameters, etc
|
Seismic Sources |
Coordinates |
Average depth (km) |
M min (Mw) |
M max (Mw) |
b |
I min |
I max |
bi |
i= =bln10 |
Seismic activity rate |
|
|
|
VRI |
45.65 |
26.15 |
130 |
5.0 |
7.9 |
0.85 |
4.0 |
10 |
0.48 |
1.12183 |
1.762380 |
|
|
45.4 |
26.5 |
|||||||||||
|
45.85 |
27.05 |
7.7 |
10 |
|||||||||
|
46.05 |
26.6 |
|||||||||||
|
VN |
45.44 |
25.65 |
30 |
3.0 |
5.9 |
0.95 |
2.5 |
7.0 |
0.6 |
1.38155 |
0.514526 |
|
|
46.22 |
26.70 |
|||||||||||
|
45.75 |
27.90 |
5.5 |
6.0 |
|||||||||
|
44.90 |
27.00 |
|||||||||||
|
BD |
46.22 |
26.70 |
10 |
2.5 |
5.5 |
0.75 |
2.0 |
6.5 |
0.49 |
1.12826 |
1.534712 |
|
|
46.7 |
26.8 |
|||||||||||
|
46.6 |
27.8 |
|||||||||||
|
45.79 |
27.66 |
|||||||||||
|
PD |
45.23 |
27.60 |
10 |
3.0 |
5.5 |
0.81 |
3.0 |
6.5 |
0.53 |
1.22405 |
0.360254 |
|
|
45.75 |
27.90 |
|||||||||||
|
45.2 |
29.3 |
|||||||||||
|
44.67 |
28.74 |
|||||||||||
|
IMF |
44.76 |
26.06 |
15 |
3.0 |
5.4 |
0.46 |
3.0 |
6.5 |
0.3 |
0.69077 |
0.034600 |
|
|
44 |
27.36 |
|||||||||||
|
45.14 |
26.39 |
|||||||||||
|
44.8 |
27.33 |
|||||||||||
|
DUL |
44.24 |
28.22 |
15 |
3.0 |
7.2 |
0.46 |
3.0 |
9.0 |
0.3 |
0.69077 |
0.028000 |
|
|
43.42 |
28.05 |
|||||||||||
|
44.00 |
26.00 |
|||||||||||
|
43.75 |
26.20 |
|||||||||||
|
BS1 |
45.11 |
30.55 |
33 |
3.0 |
3.5 Mb=4.7 |
0.81 |
2.5 |
3.5 |
0.53 |
1.22405 |
0.386363 |
|
|
44.56 |
30.36 |
|||||||||||
|
44.9 |
29 |
|||||||||||
|
45.55 |
29.6 |
|||||||||||
|
BS2 |
44.24 |
28.22 |
11 |
3.0 |
5.0 |
0.65 |
2.5 |
5.5 |
0.43 |
0.99011 |
0.118644 |
|
|
44.9 |
29 |
|||||||||||
|
44.48 |
30.69 |
|||||||||||
|
43.77 |
30.57 |
|||||||||||
|
43.32 |
29.56 |
|||||||||||
|
BS3 |
44.24 |
28.22 |
16.4 |
3.0 |
7.2 |
0.32 |
2.5 |
9.0 |
0.21 |
0.48354 |
0.165137 |
|
|
43.32 |
29.56 |
|||||||||||
|
43.03 |
29.39 |
|||||||||||
|
43.42 |
28.05 |
|||||||||||
|
BS4 |
41.19 |
28.07 |
22.1 |
3.0 |
6.7 |
0.53 |
2.5 |
8.0 |
0.35 |
0.8059 |
0.47761 |
|
|
42.28 |
28.72 |
|||||||||||
|
41.89 |
31.52 |
|||||||||||
|
40.94 |
31.82 |
|||||||||||
|
BS5 |
40.93 |
31.82 |
14.8 |
3.0 |
6.1 |
0.61 |
2.5 |
7.5 |
0.40 |
0.92103 |
0.740741 |
|
|
41.89 |
31.52 |
|||||||||||
|
42.77 |
34.17 |
|||||||||||
|
40.97 |
40.92 |
|||||||||||
|
BS6 |
41.22 |
39.99 |
13.5 |
3.0 |
5.5 |
0.59 |
2.5 |
6.5 |
0.39 |
0.89800 |
1.039215 |
|
|
43.17 |
40.01 |
|||||||||||
|
42.92 |
41.83 |
|||||||||||
|
40.93 |
41.69 |
|||||||||||
|
BS7 |
44.89 |
35.83 |
20.8 |
3.0 |
5.2 |
0.75 |
2.5 |
6.0 |
0.50 |
1.15129 |
0.59091 |
|
|
45.40 |
36.70 |
|||||||||||
|
43.46 |
40.24 |
|||||||||||
|
42.96 |
39.52 |
|||||||||||
|
BS8 |
44.09 |
32.86 |
22.8 |
3.0 |
6.5 |
0.38 |
2.5 |
8.0 |
0.25 |
0.57564 |
0.25301 |
|
|
45.32 |
32.63 |
|||||||||||
|
44.83 |
35.65 |
|||||||||||
|
43.72 |
35.06 |
|||||||||||
|
BS9 |
45.05 |
30.77 |
14.8 |
3.0 |
4.9 |
0.61 |
2.5 |
5.5 |
0.40 |
0.9163 |
0.19512 |
|
|
45.69 |
30.94 |
|||||||||||
|
45.62 |
31.71 |
|||||||||||
|
44.98 |
31.47 |
|||||||||||
|
BS10 |
42.51 |
30.48 |
26.9 |
3.0 |
3.9 |
0.72 |
2.5 |
4.0 |
0.48 |
1.10524 |
0.25581 |
|
|
44.54 |
31.26 |
|||||||||||
|
44.30 |
32.48 |
|||||||||||
|
42.40 |
31.84 |
|||||||||||
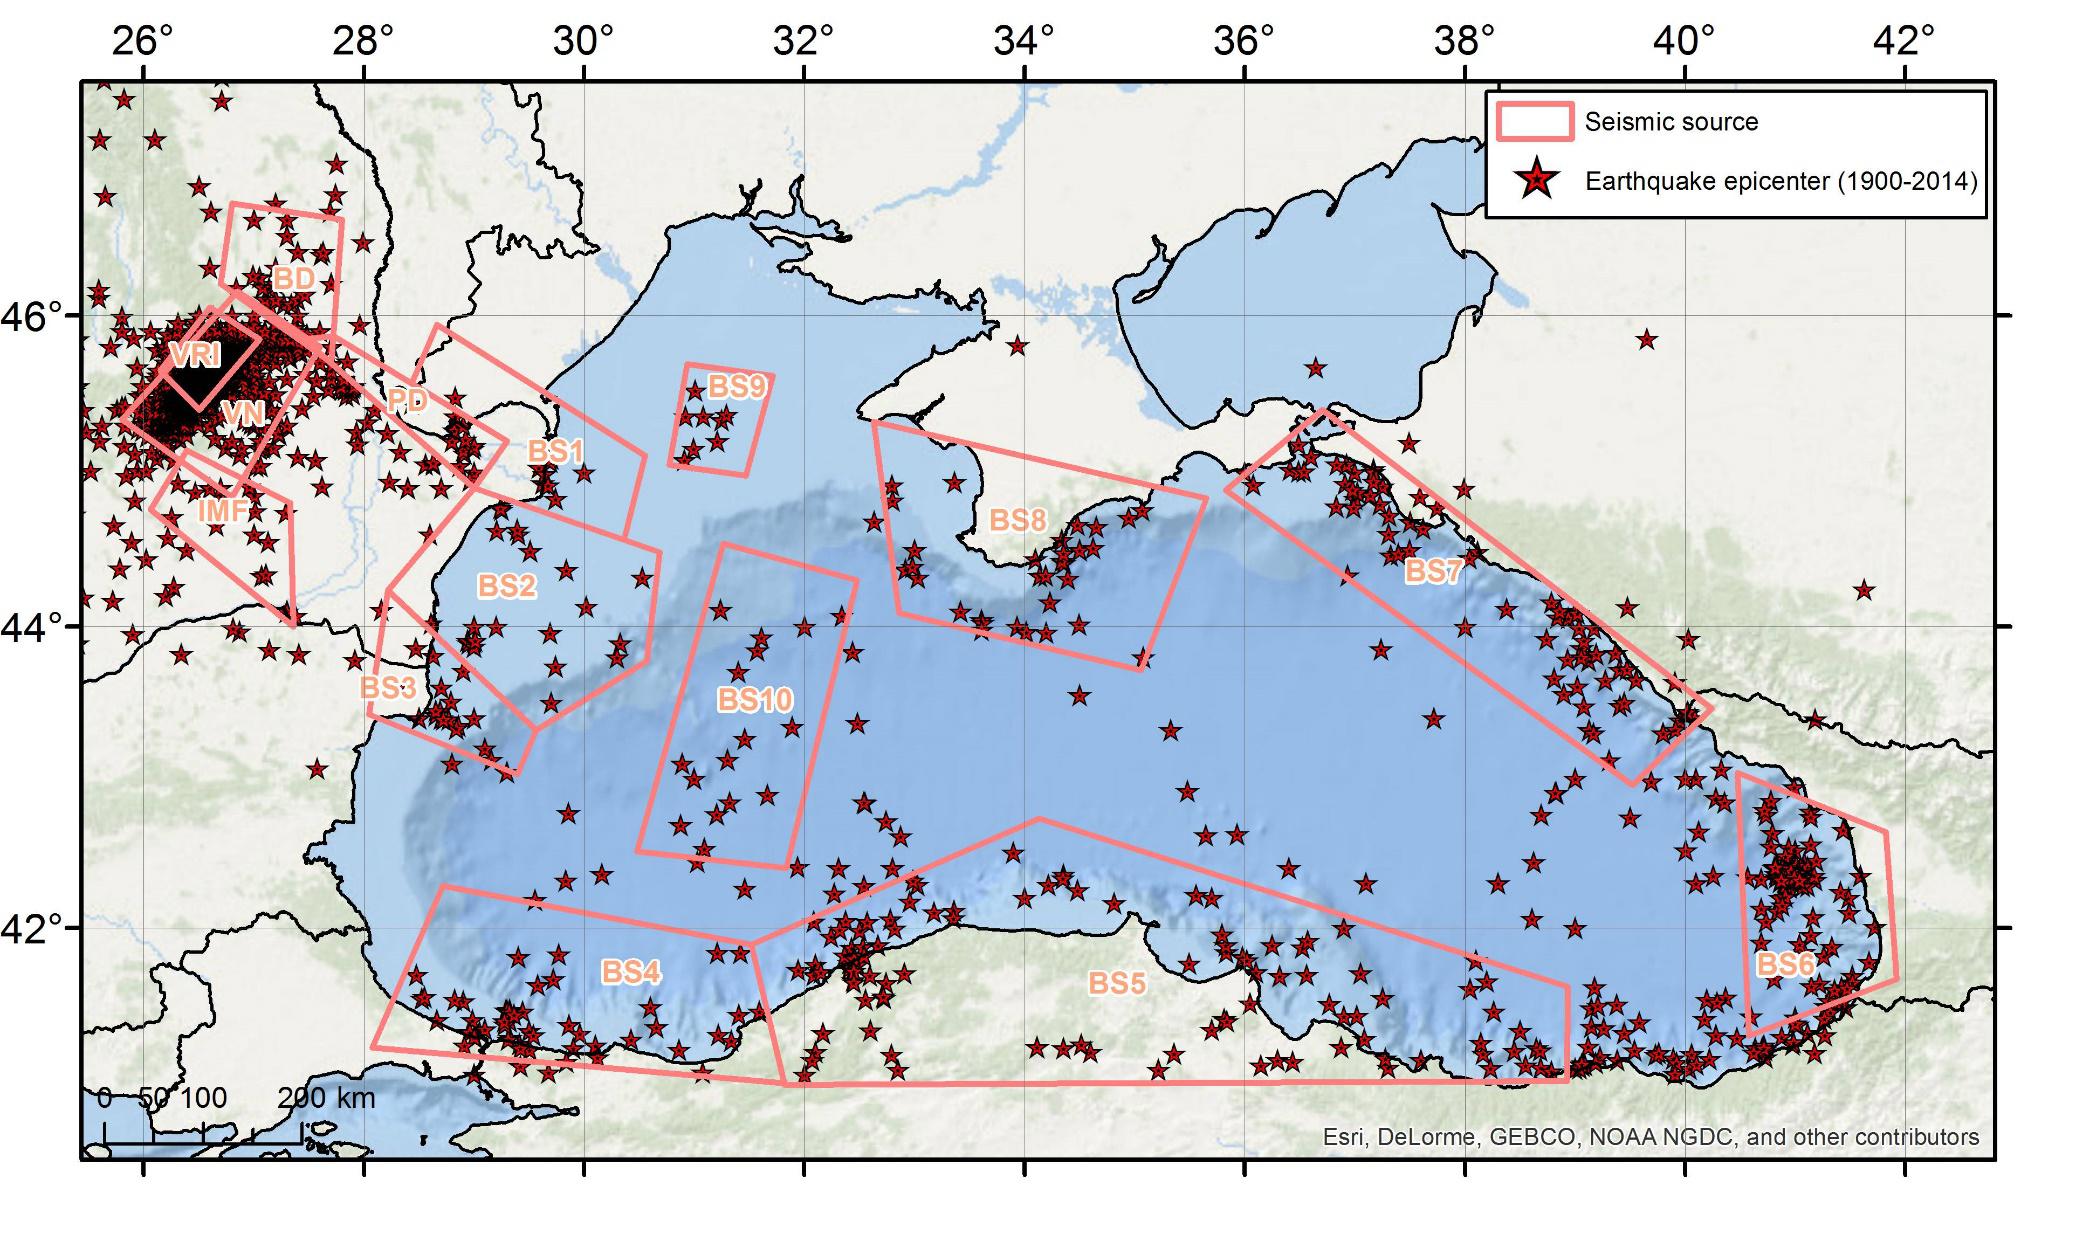 Figure 1. The seismic zonation of the Eastern part of Romania and the Black Sea Area
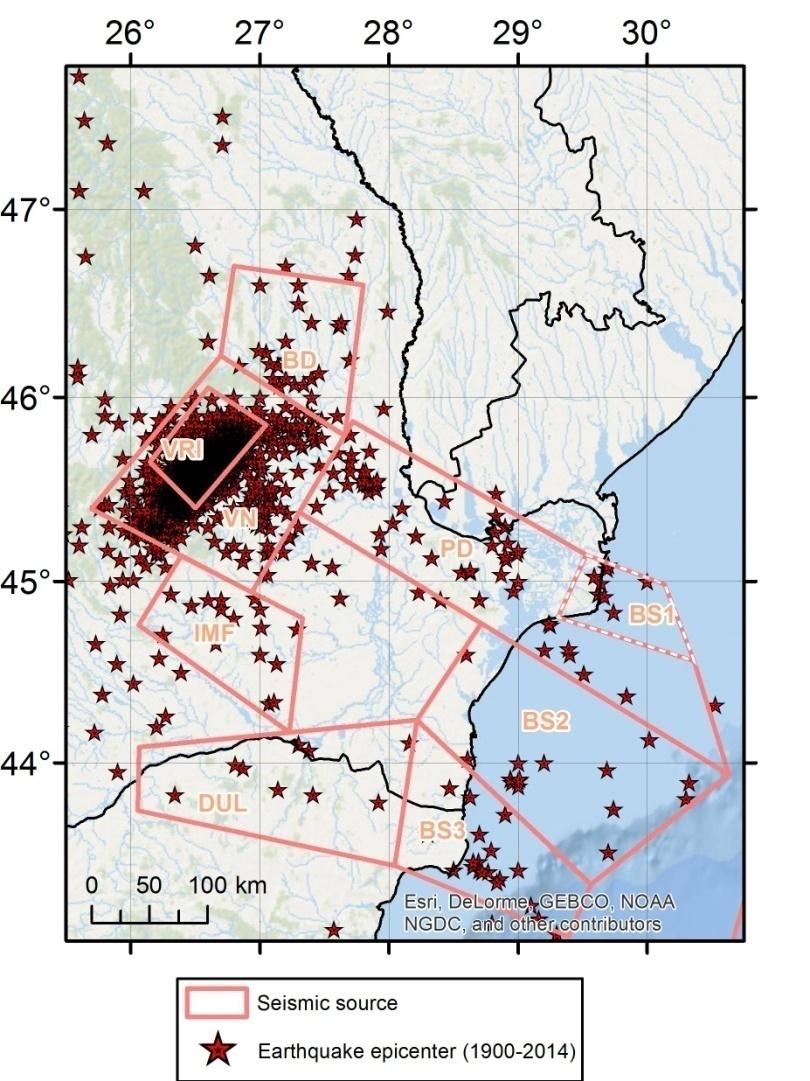 Figure 2. Zoom on the marine seismic sources near the Romanian Black Sea Coast. We plotted epicenters for Mw>3.5 for the inland sources and Mw>3.0 for the marine sources.